Security-focused Grafana dashboard for Windows hosts covering authentication, firewall events, Defender status, updates, and core security posture indicators.
Project Overview
This project provides a centralized security monitoring view for Windows servers and workstations through Grafana dashboards backed by collected Windows metrics and security event telemetry.
What Is Included
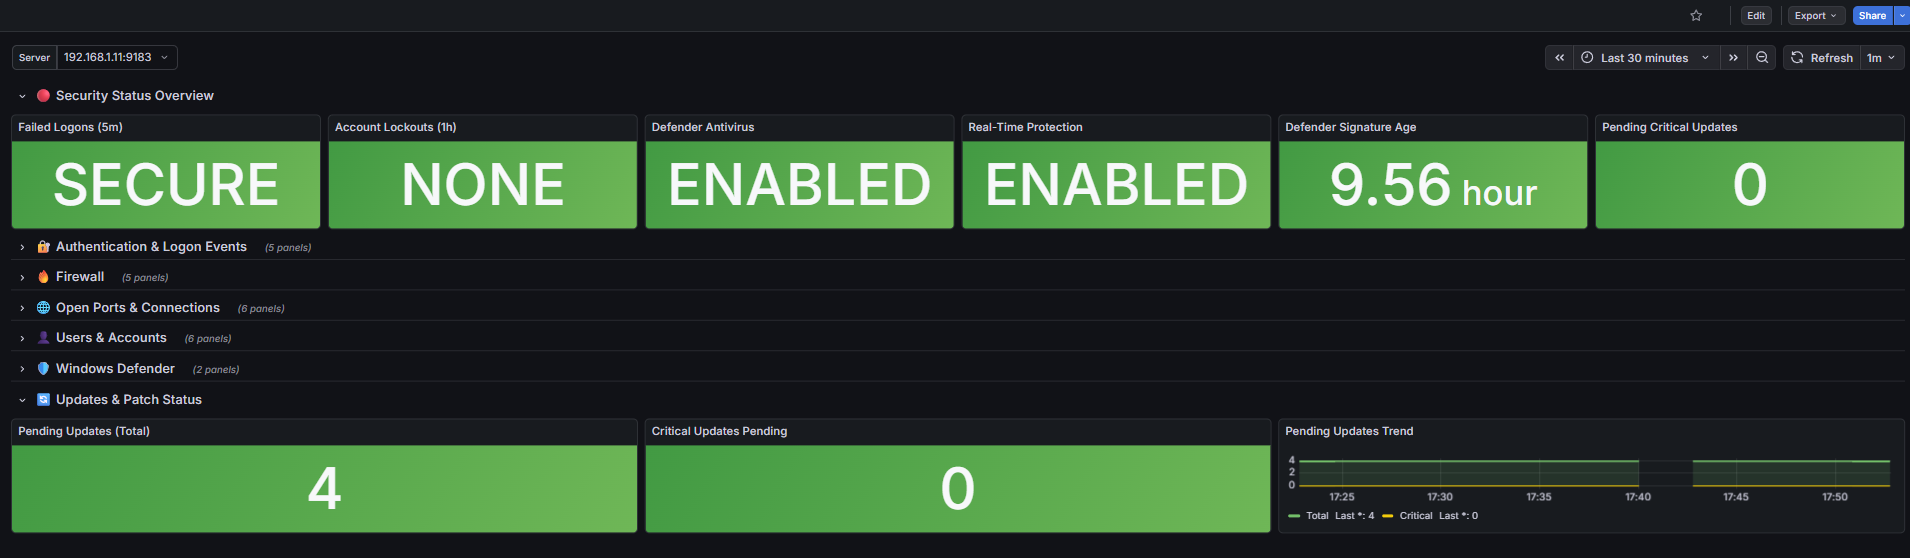
- Security overview panels for quick posture checks
- Authentication monitoring (success/failure trends)
- Firewall activity and event visibility
- Defender and user-related security signals
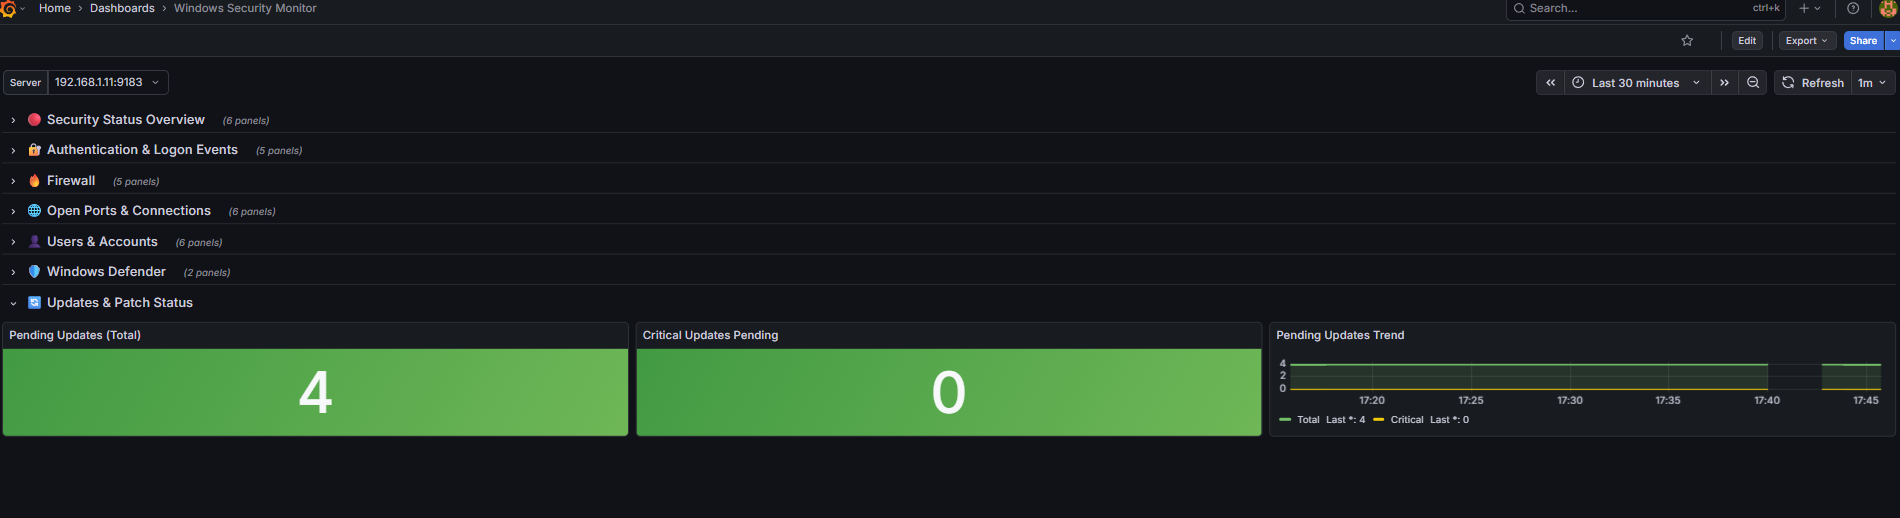
- Update and patch-status tracking
Result
A practical, operations-ready security dashboard that improves visibility, shortens incident triage time, and helps maintain a consistent Windows security baseline.
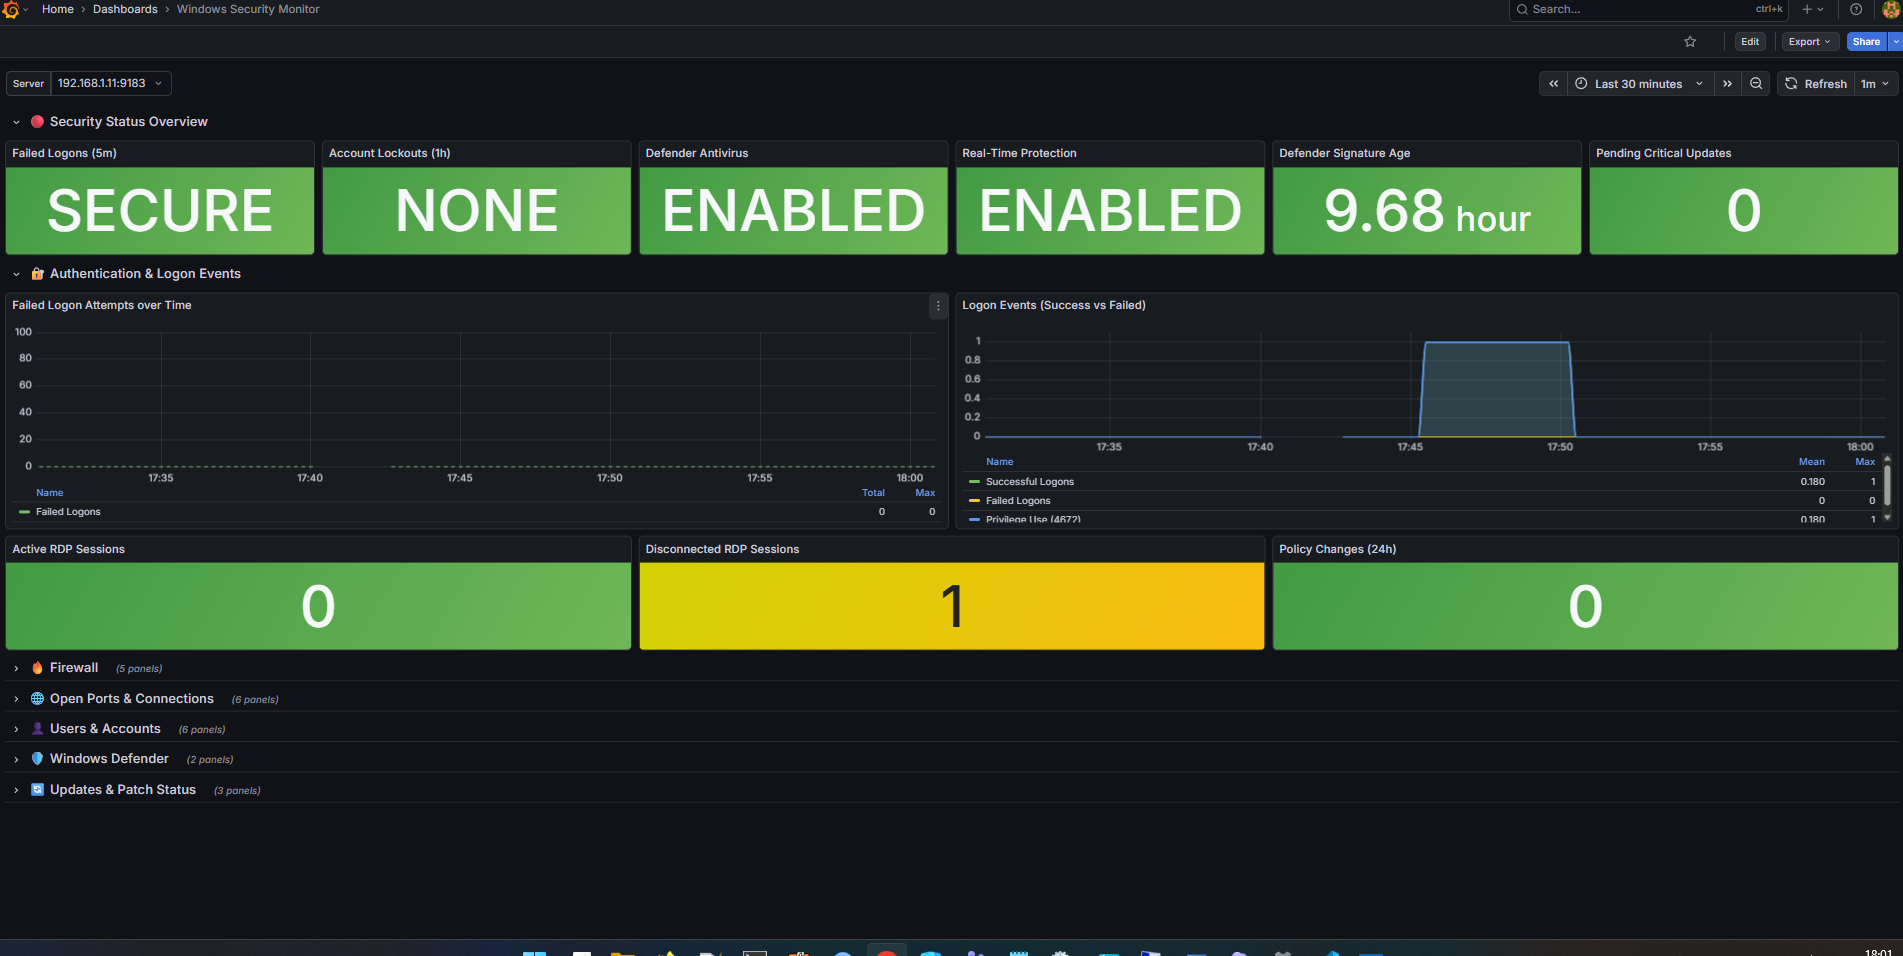
Security overview panel with top-level Windows security KPIs.
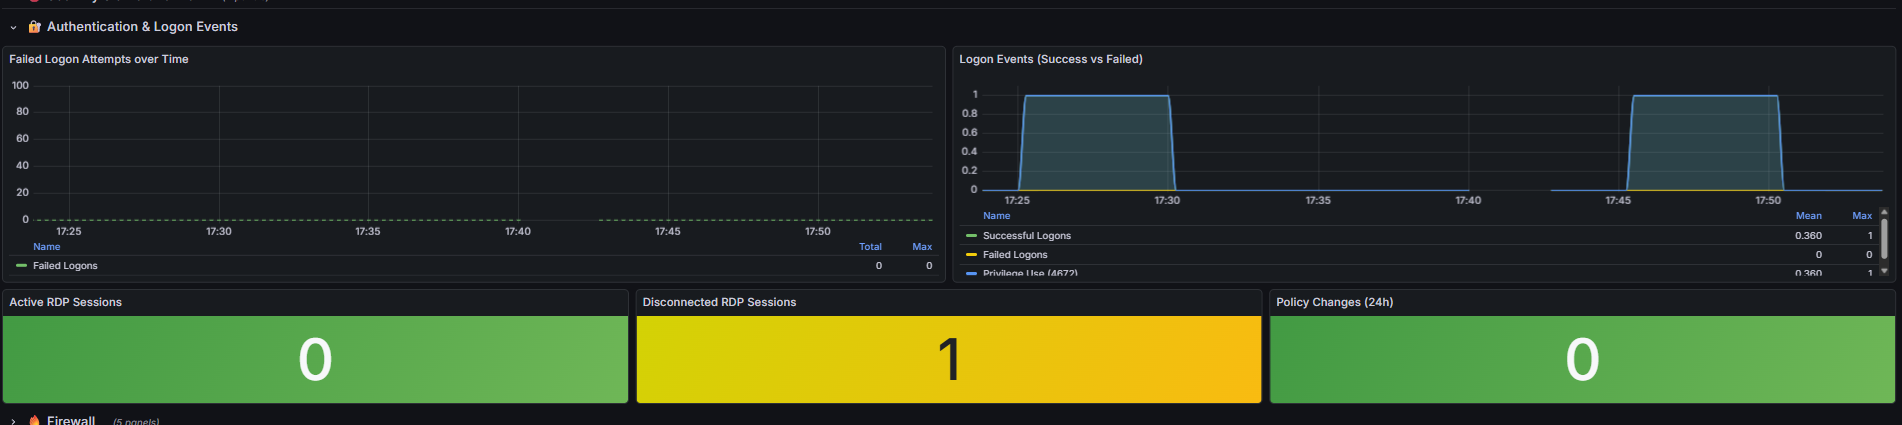
Authentication monitoring for successful and failed logon activity.
Security events dashboard for high-signal operational and threat indicators.
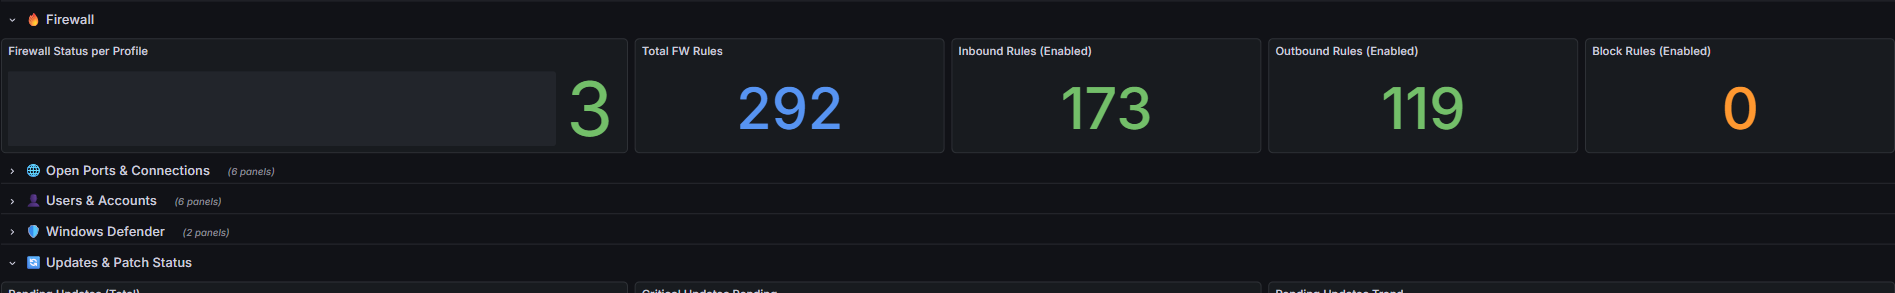
Firewall-focused panel tracking allowed/blocked traffic patterns.
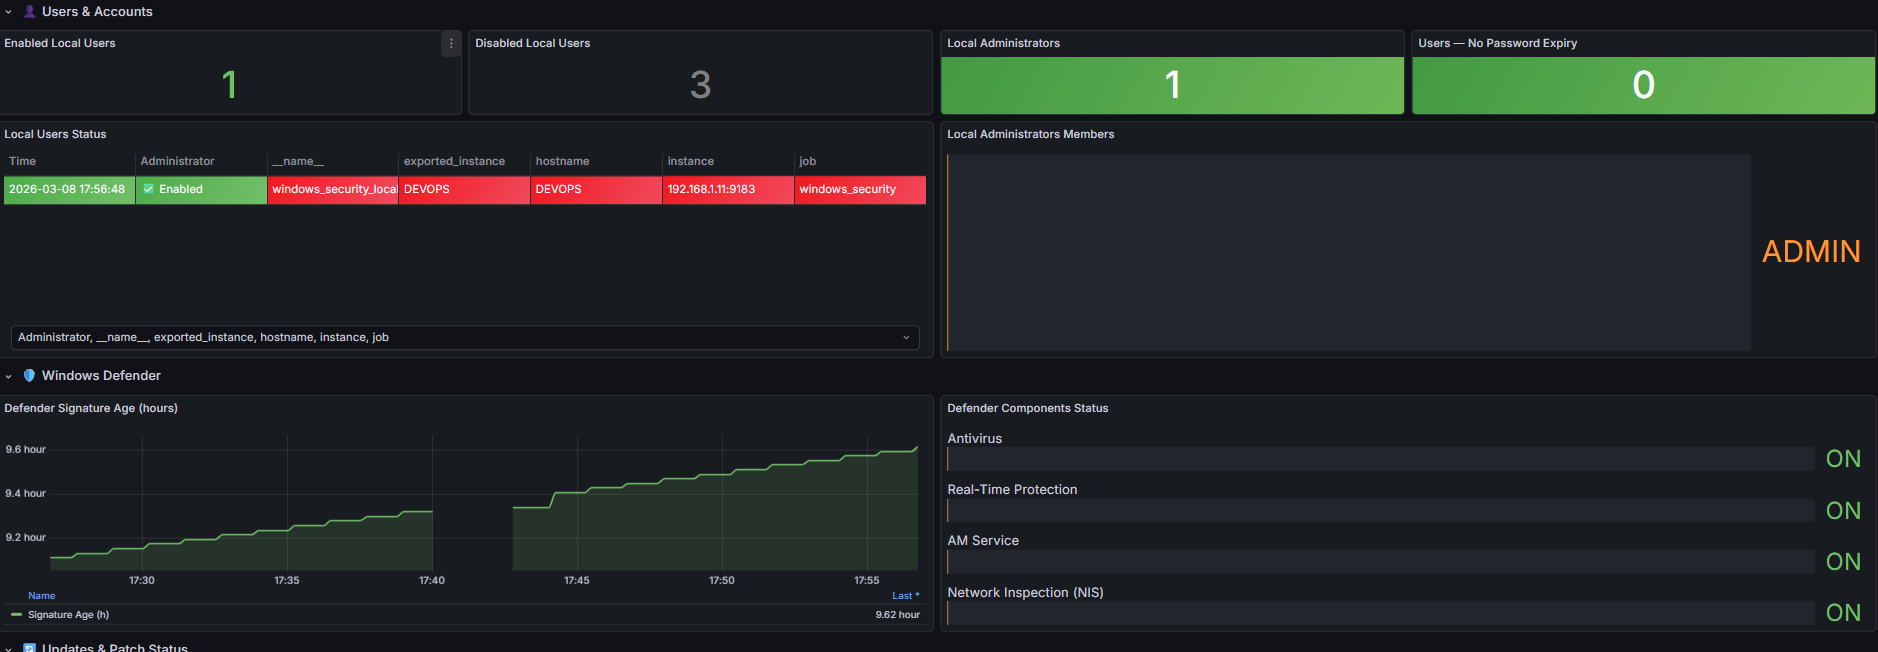
User and Defender visibility including account and endpoint protection state.

Windows updates compliance and patch monitoring panels.
Detailed dashboard view showing panel composition and metric grouping.

Additional dashboard section focused on trend comparison across panels.
Final dashboard segment with expanded security telemetry context.