Project Overview
This project centralizes infrastructure visibility for Windows systems with Prometheus as the metrics backend and Grafana as the dashboard layer.
What Is Included
- Host-level metrics collection
- Service and resource dashboards
- Alerting flow with Alertmanager
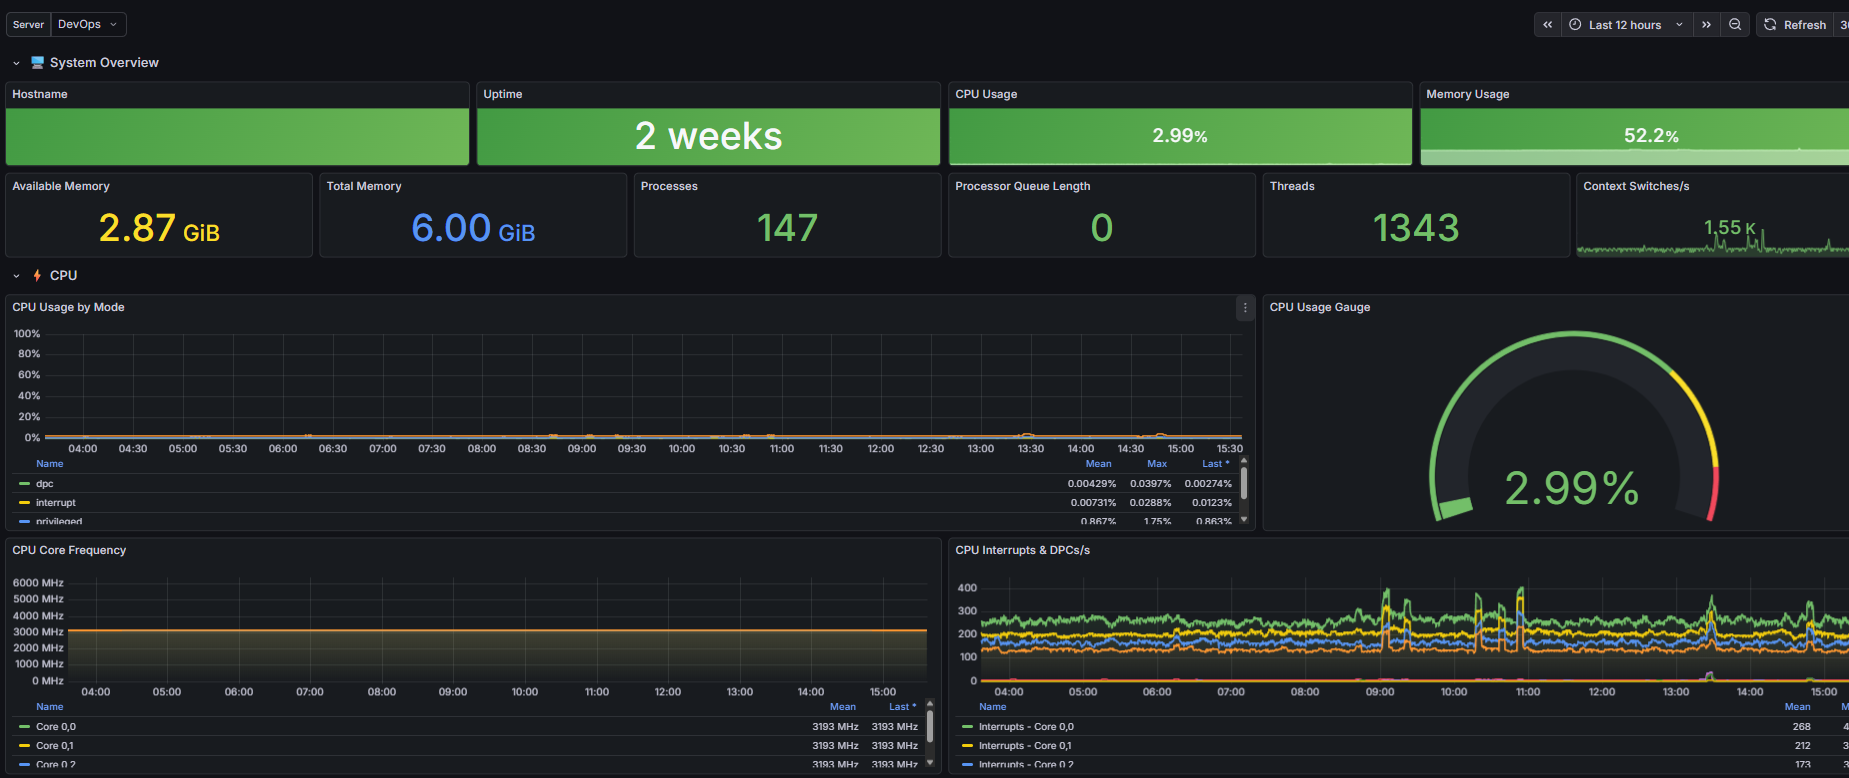
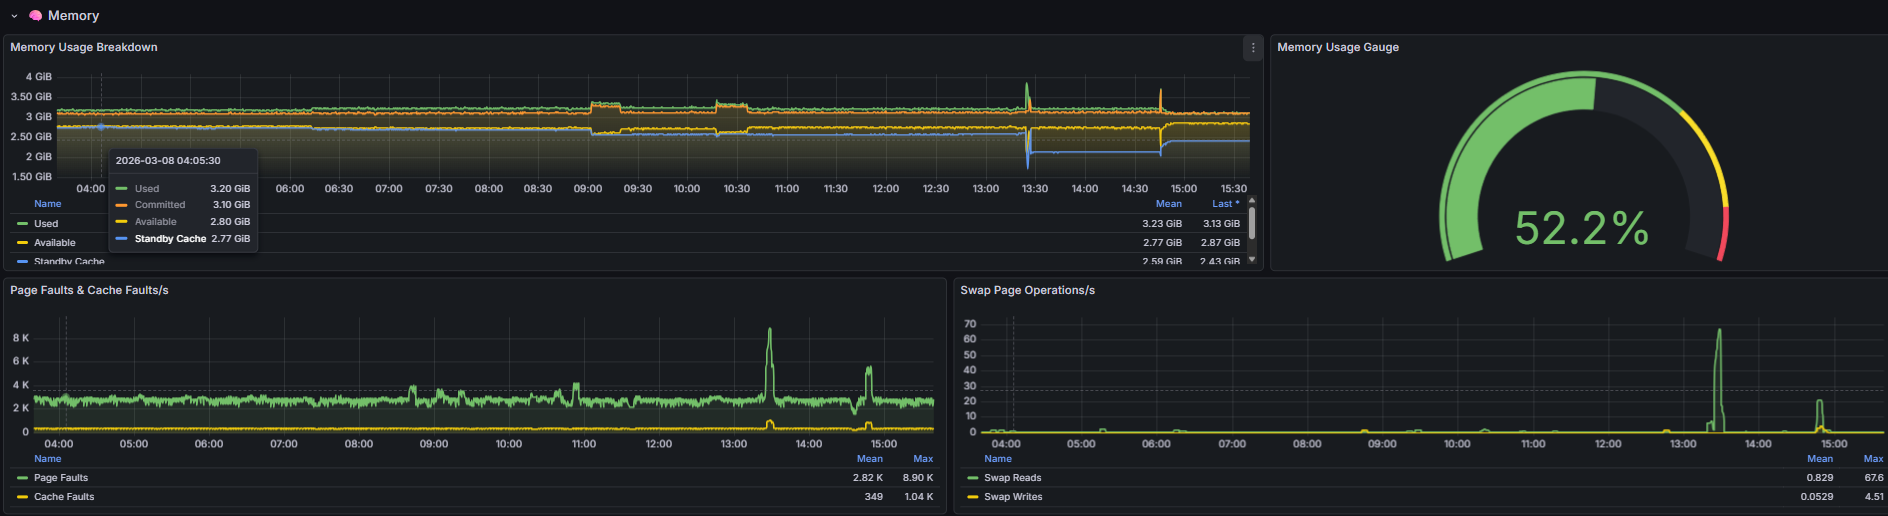
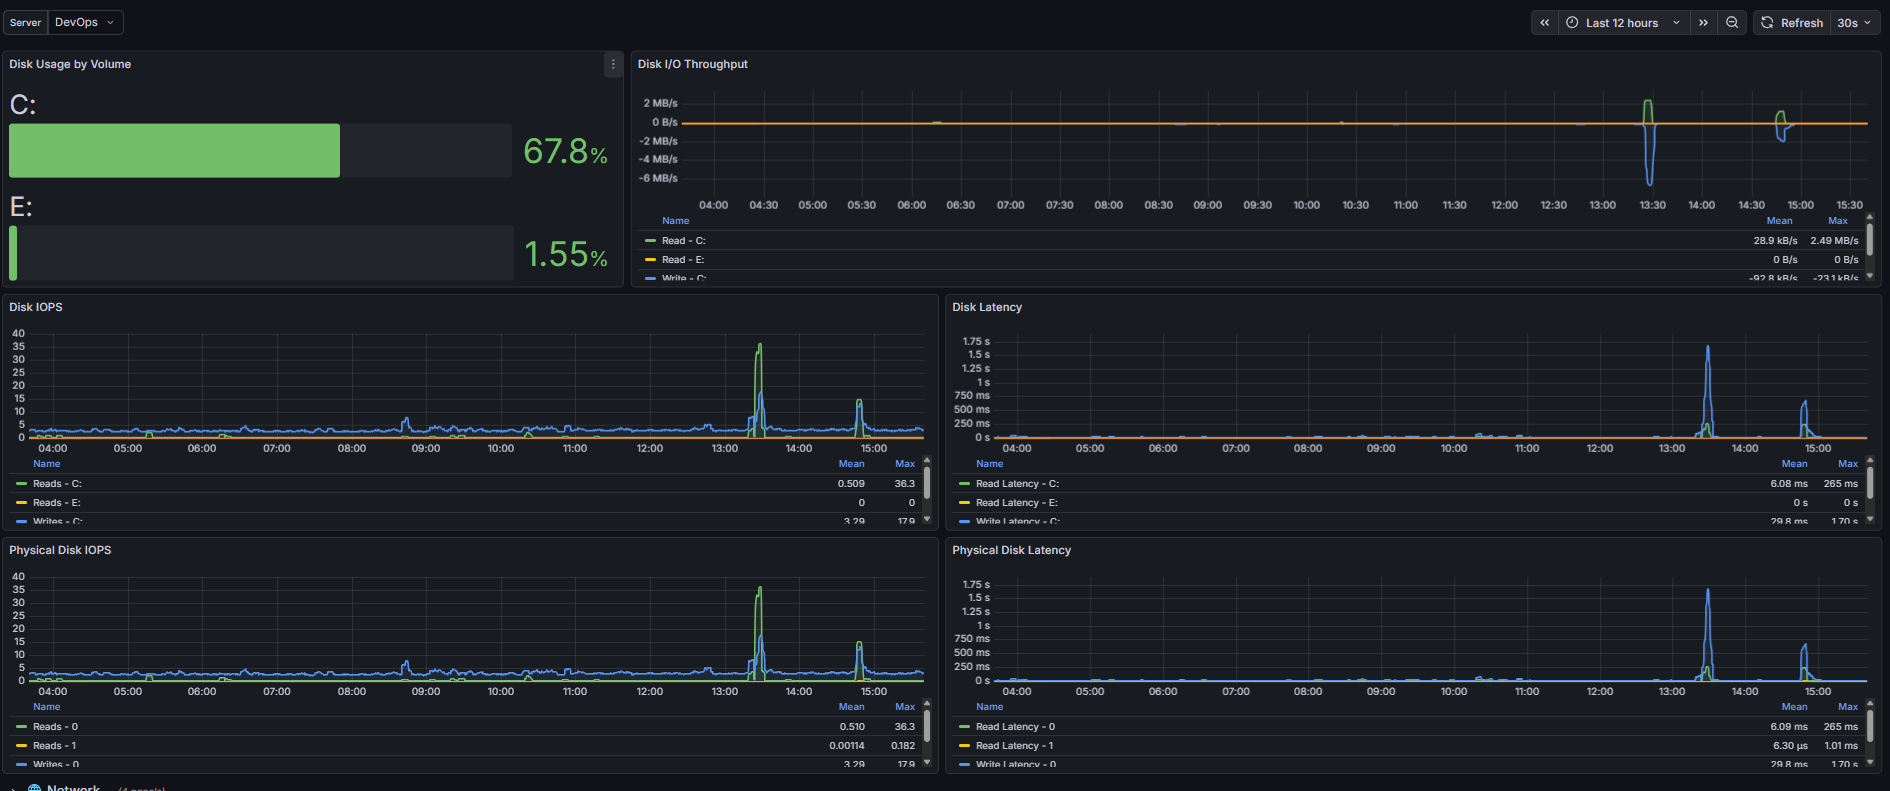
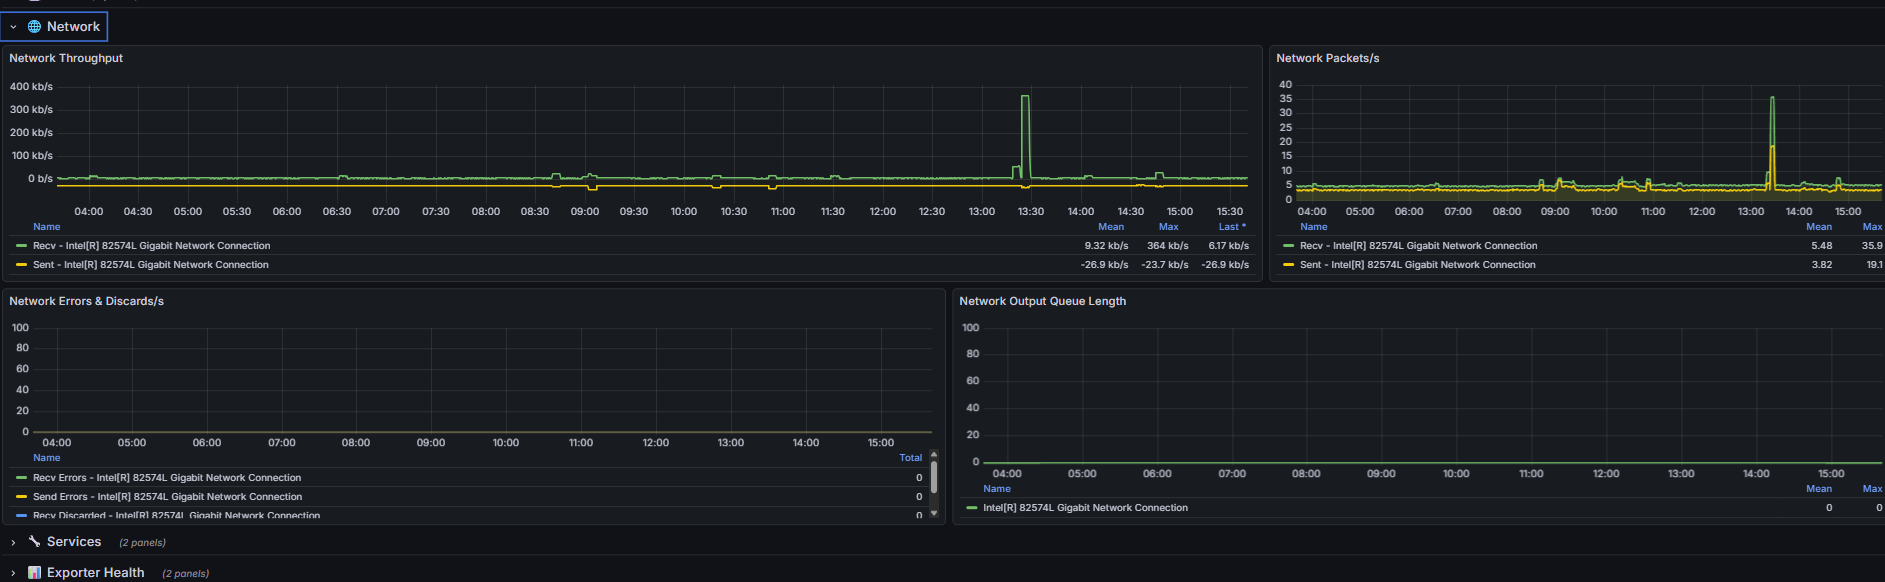
- Baseline panels for CPU, memory, disk, and network
Result
Improved observability, faster incident response, and consistent monitoring across multiple Windows servers.