Project Overview
CyberOps Portal (SecurityPulse) is my largest and most complete lab project: a self-hosted, production-style security operations platform built to answer one concrete daily question:
What should be fixed first, and why?
The platform combines threat intelligence ingestion, environment-aware prioritization, and stable service delivery in a realistic infrastructure layout.
Project Goal
The goal is not just “collect data”. The goal is to reduce decision latency for operations and security workflows.
The portal is designed to help a team move from raw vulnerability intelligence to actionable triage in minutes, not hours.
Lab Scope and Environment
The lab is fully self-hosted and runs in a segmented virtualized environment.
- Hypervisor layer: VMware ESXi
- App stack: ASP.NET Core (.NET 8)
- Web delivery: IIS web nodes behind NGINX reverse proxy/load balancer
- Data storage: PostgreSQL (primary data), SQLite (lightweight/local workflows)
- Edge exposure: Cloudflare Tunnel (no direct public port-forwarding)
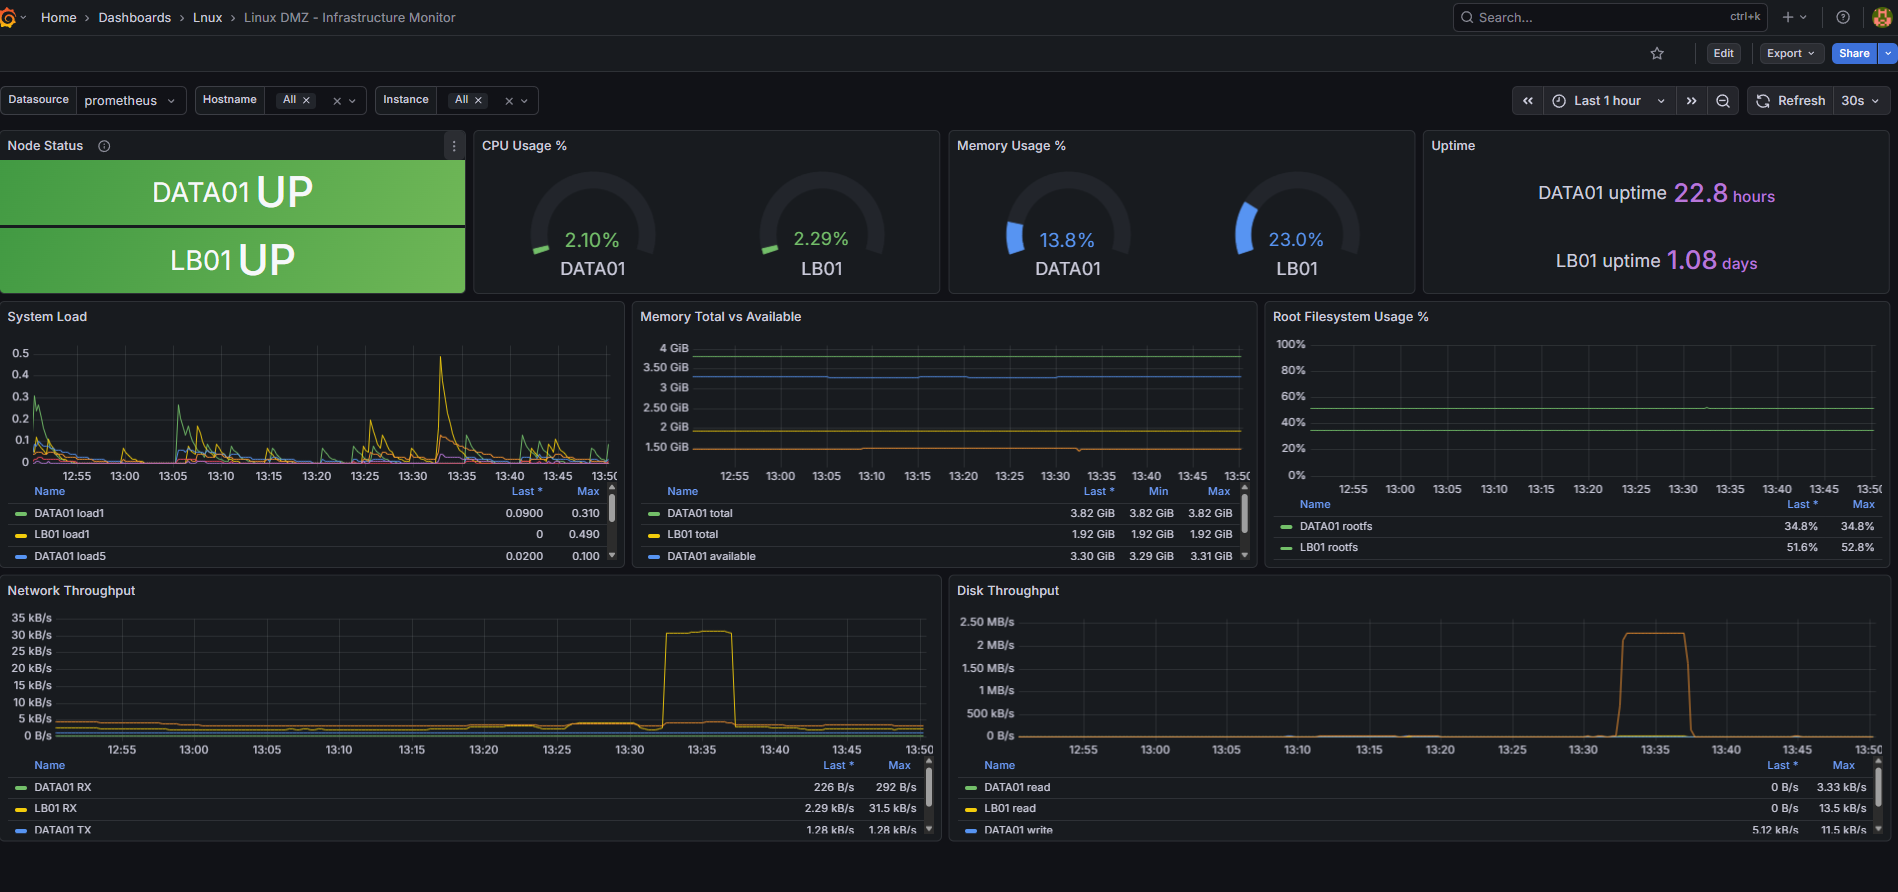
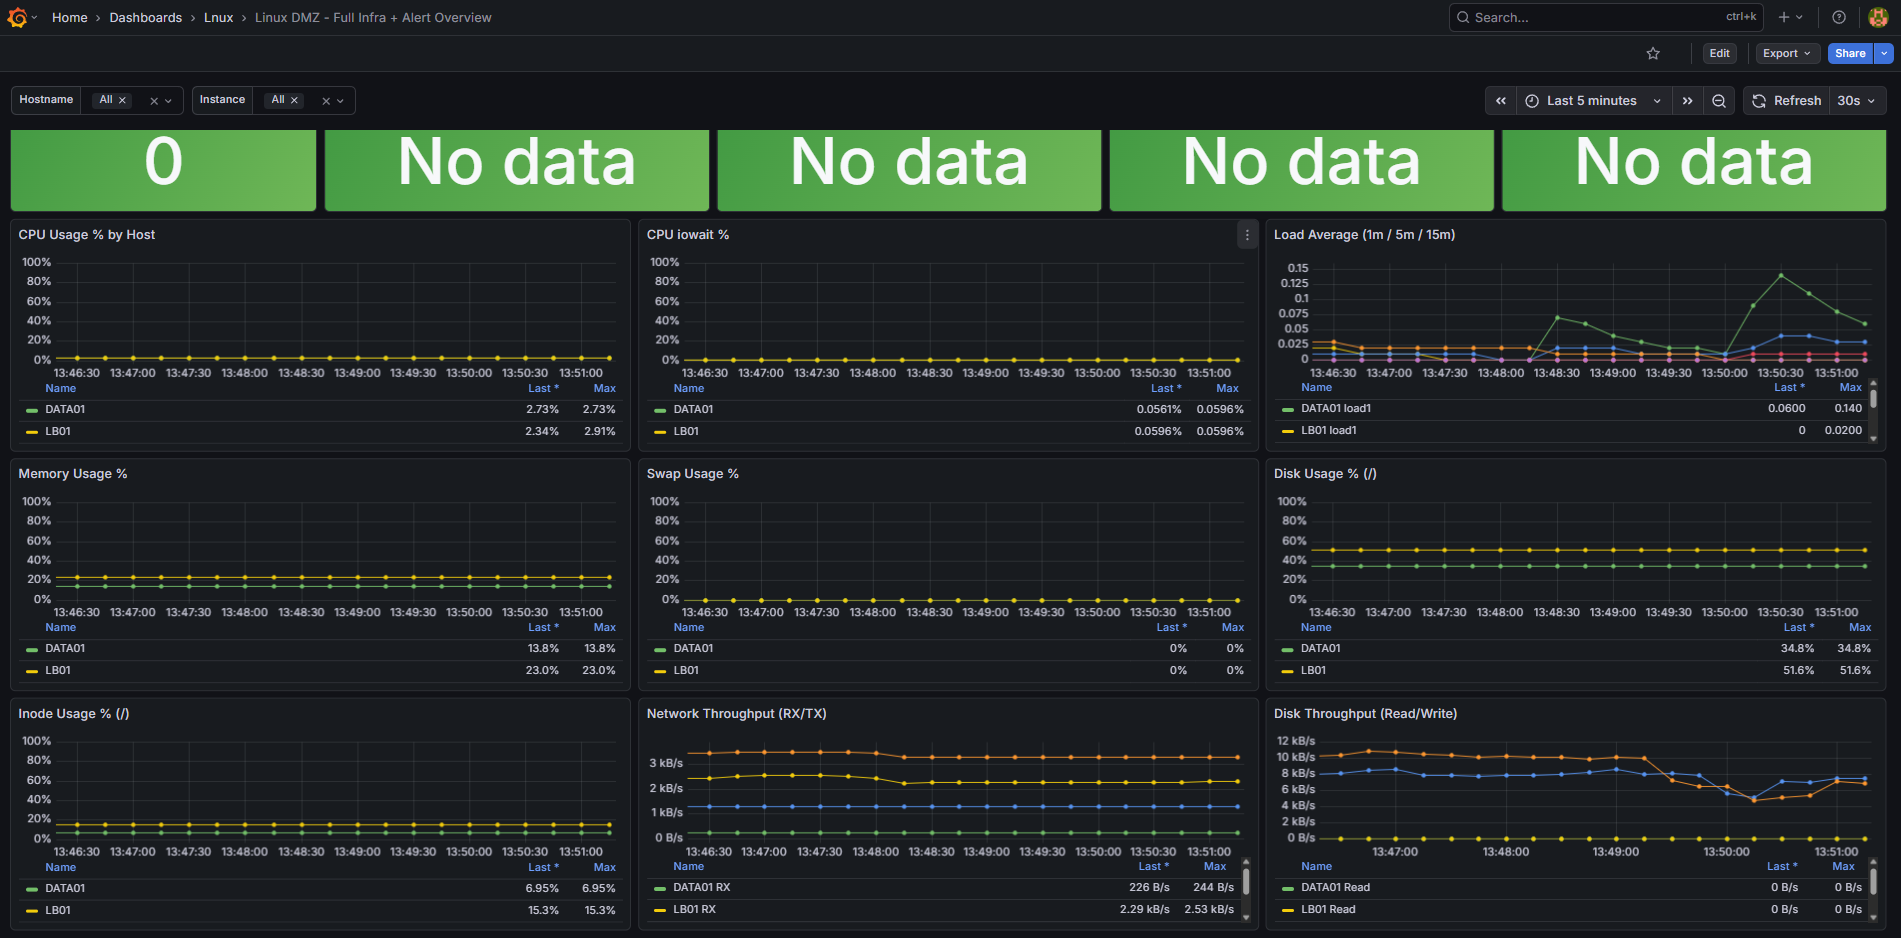
- Observability: Prometheus + Grafana
Infrastructure Topology
- Public edge: Cloudflare Tunnel terminates external access and forwards traffic safely into the internal network.
- Load balancing layer: NGINX node (LB01) distributes traffic to the web tier.
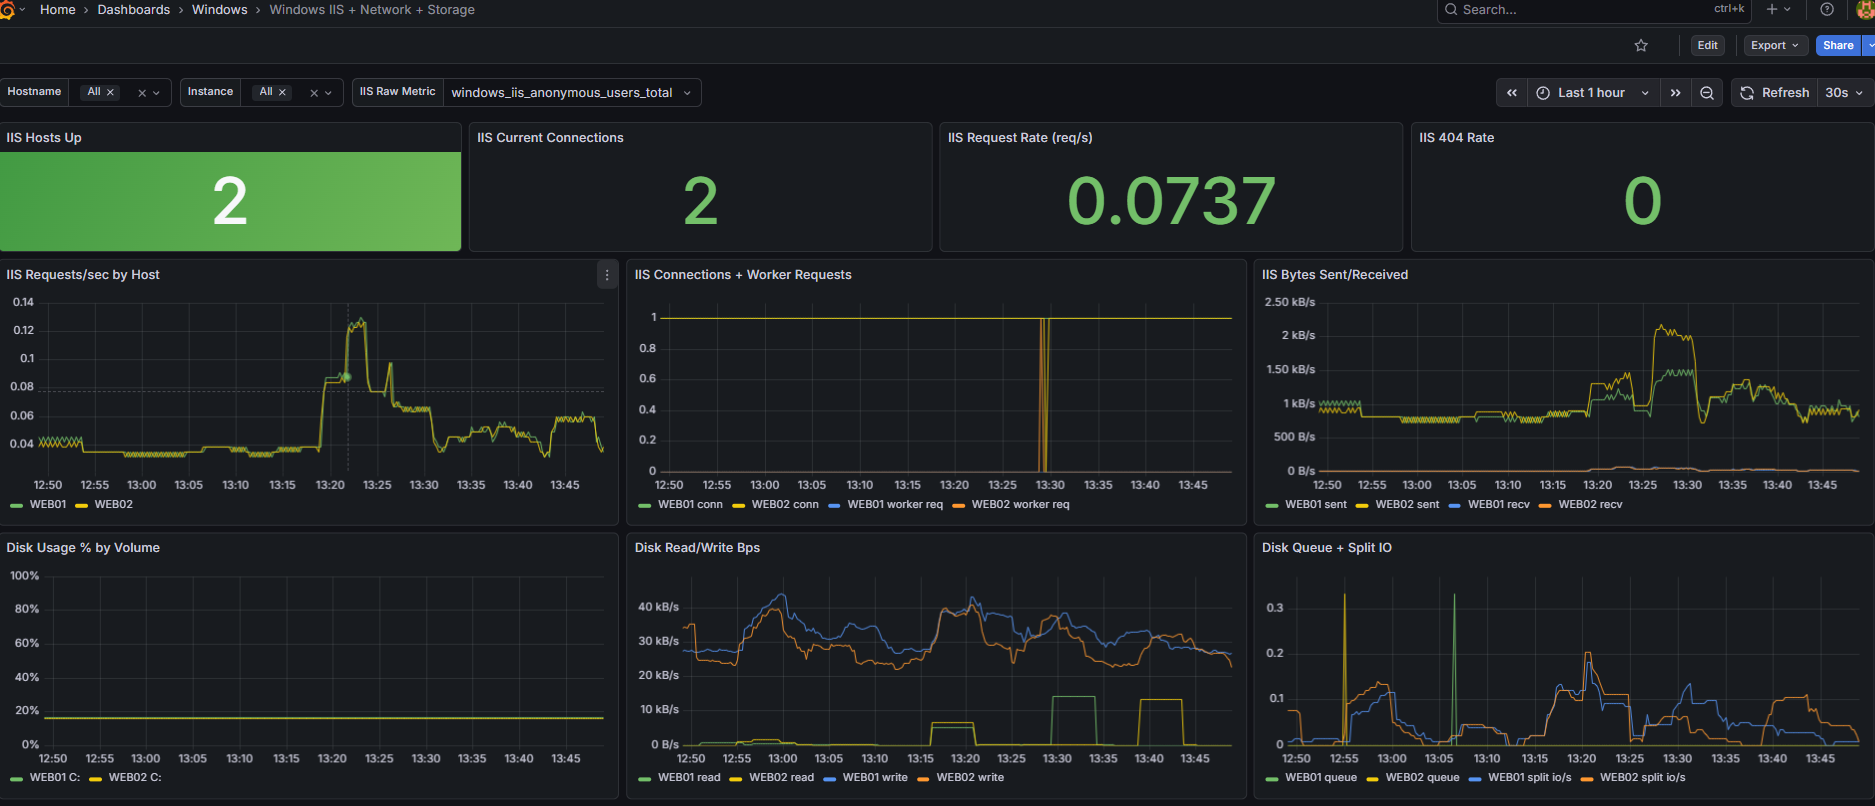
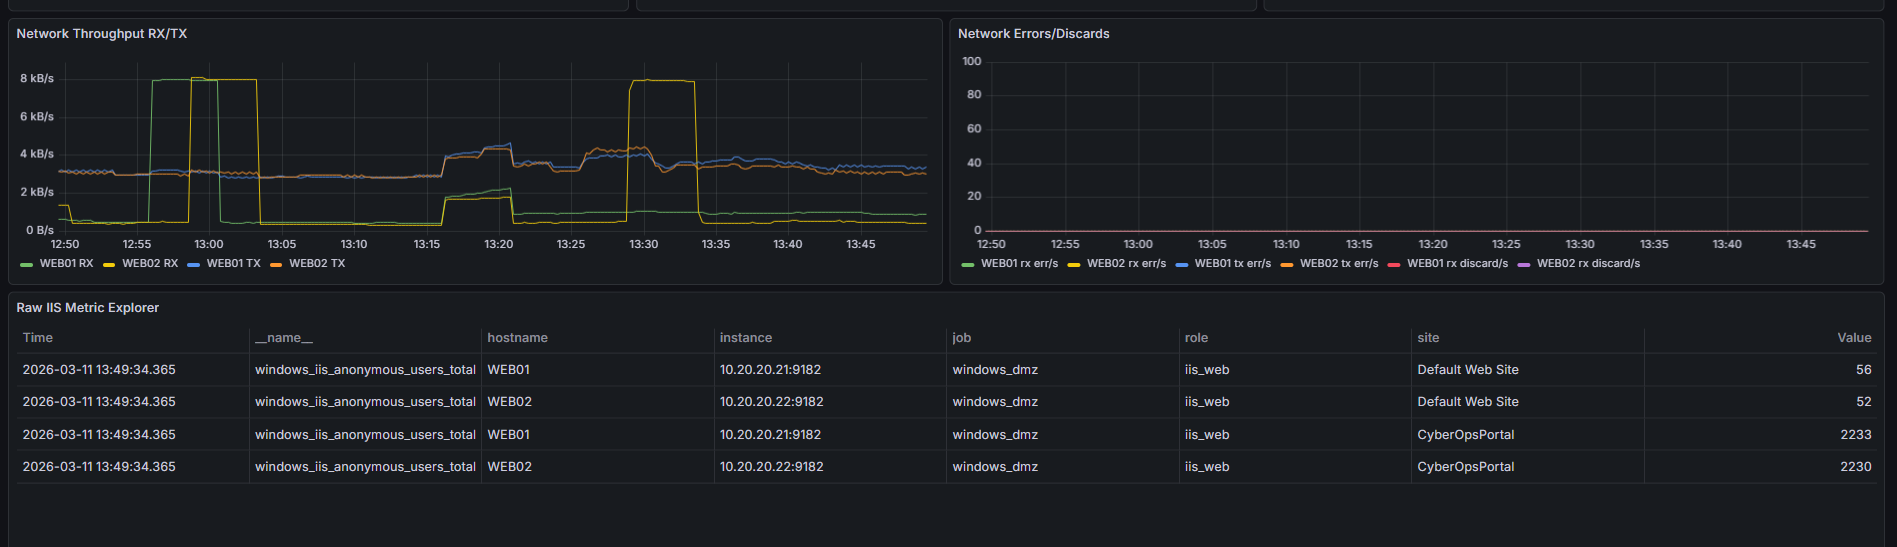
- Web tier: WEB01 + WEB02 (Windows Server + IIS) in active-active style serving the portal.
- Data tier: DATA01 with PostgreSQL and ingestion/normalization pipelines.
- Observability tier: Prometheus and Grafana for health, resource, and service visibility.
- Network model: segmented lab topology with internal trust boundaries and controlled exposure.
Portal Capabilities (Site/Product)
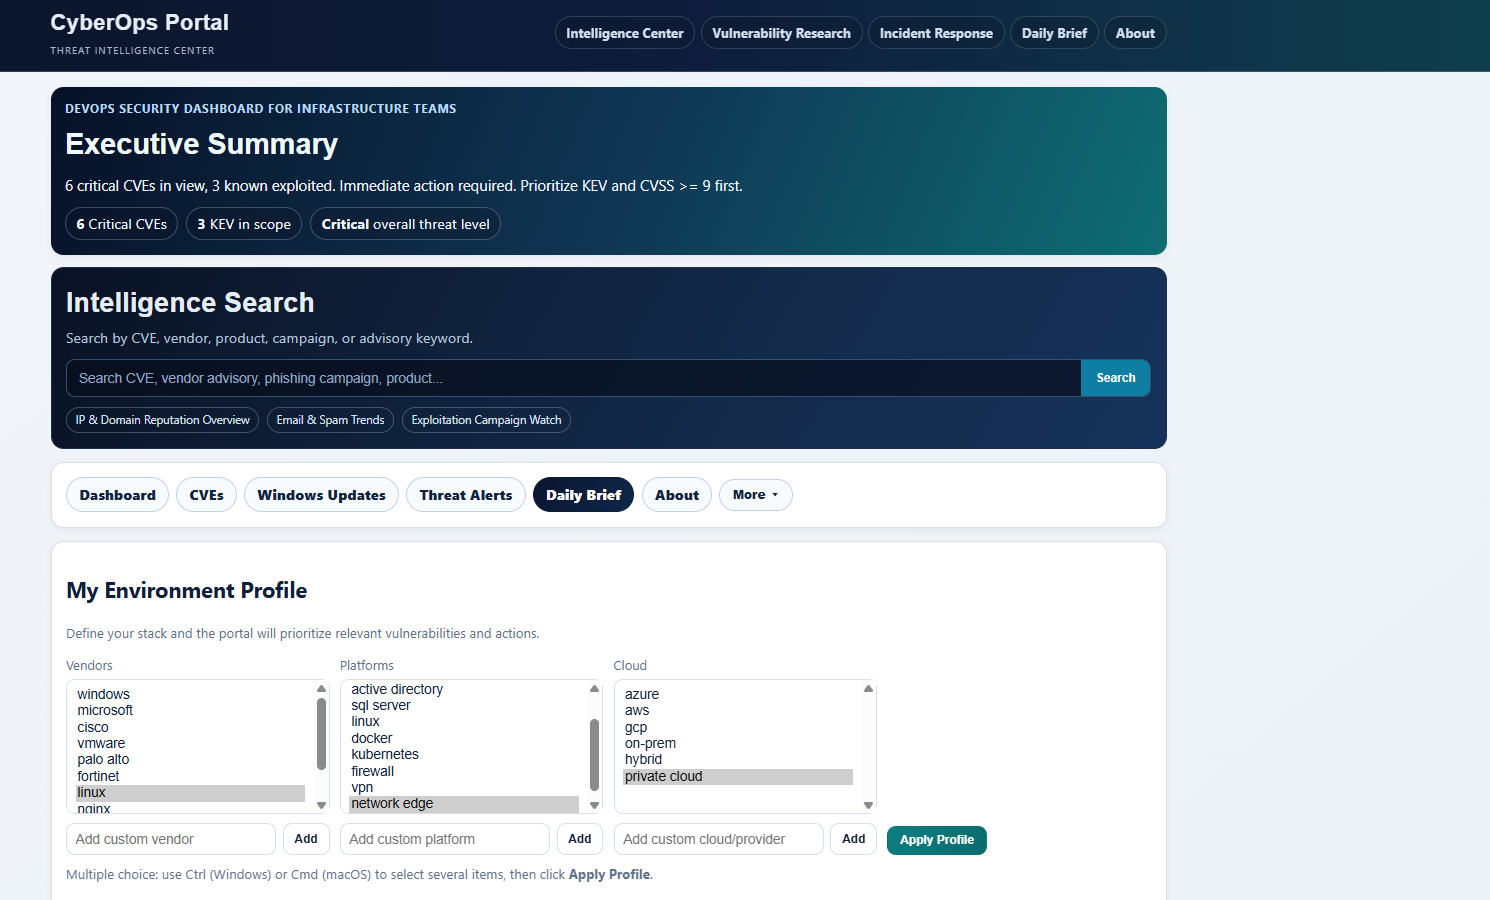
The SecurityPulse site is built as an operator-facing console, not a generic dashboard page.
Core functional blocks:
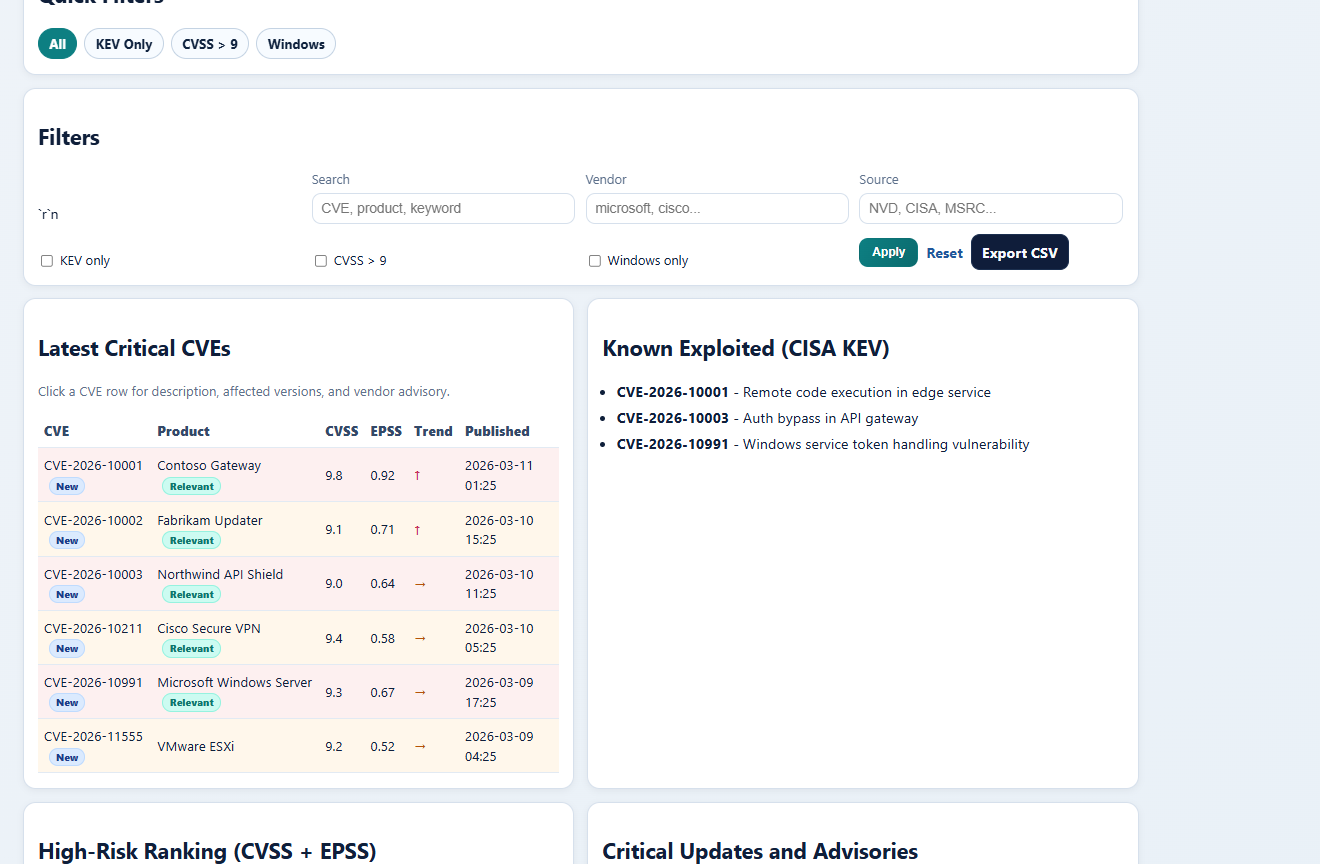
- Threat Intake: ingest and normalize data from CVE, KEV, EPSS, MSRC, and CISA-style sources.
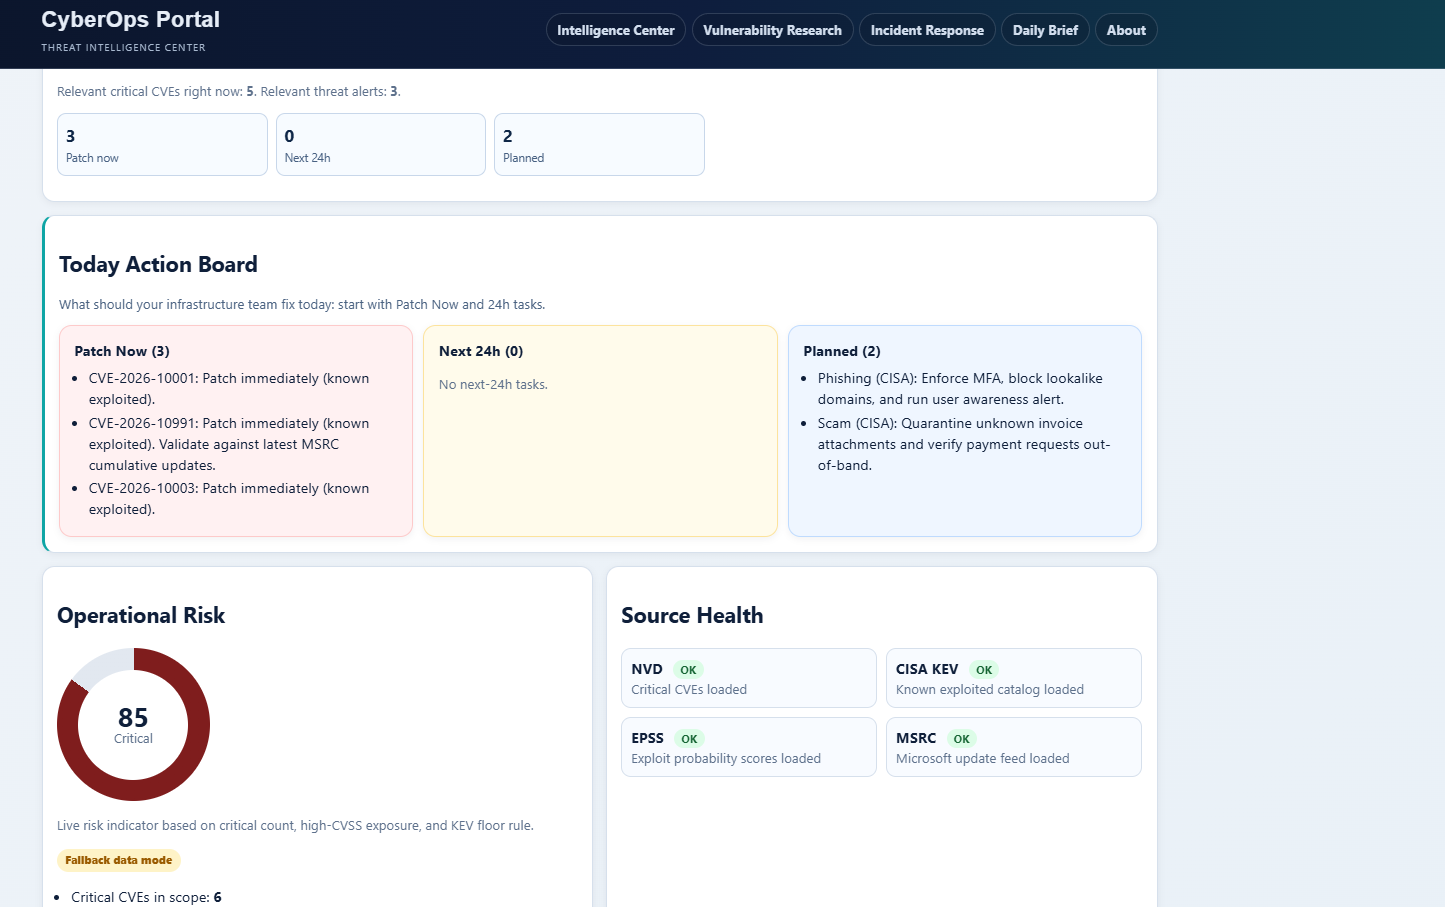
- Fix-Today Queue: prioritized shortlist of high-impact items based on severity and environment context.
- Environment Matching: map advisories to relevant vendor/platform/cloud profile attributes.
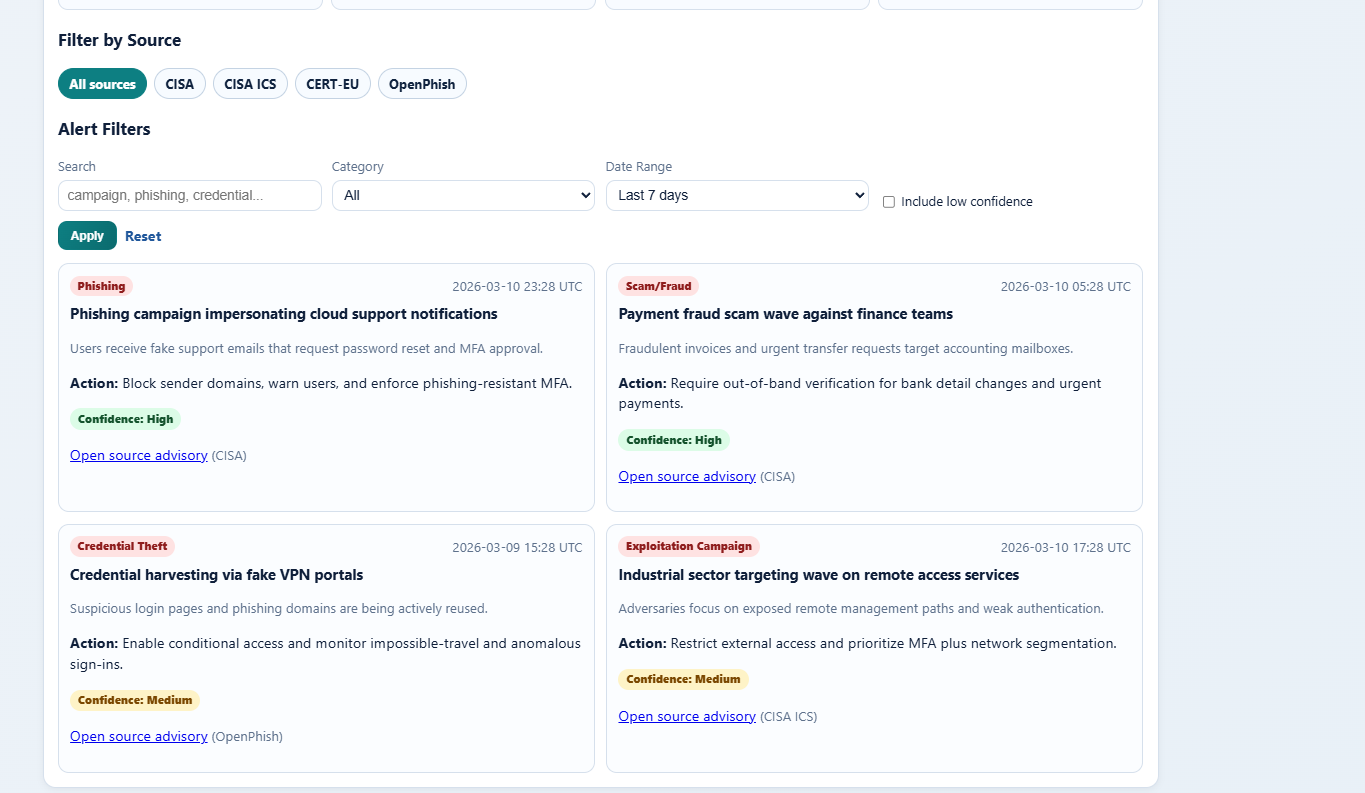
- Operational Briefing: morning-ready summary view for quick standup-level decisions.
- Triage Workflow: move from advisory details to action state with practical filtering and export.
- Historical Traceability: preserve snapshots and fallback-safe behavior when external feeds change or fail.
Data Pipeline Logic
- Pull feeds from multiple security intelligence sources.
- Normalize fields and deduplicate records.
- Enrich with context (severity signals, exploitability indicators, recency).
- Score and rank for actionable prioritization.
- Serve results in the portal UI and operational exports.
This pipeline model keeps the output deterministic and easier to validate during testing.
High Availability and Reliability Decisions
- IIS is deployed on two web nodes to avoid single-node dependency.
- NGINX handles distribution and protects backend nodes from direct external access.
- Cloudflare Tunnel removes the need for direct inbound router exposure.
- Data persistence is centralized to keep application state consistent.
- Observability is integrated from the beginning rather than added late.
Security and Operational Design Choices
- Minimized public attack surface through tunnel-based exposure.
- Layered routing between edge, LB, and internal tiers.
- Clear separation between web handling, business logic, and data handling.
- Monitoring-backed operations for faster fault isolation and recovery.
What Was Built in Practice
- End-to-end lab architecture and service wiring.
- Portal backend and UI workflow for security prioritization.
- HA delivery model with NGINX + dual IIS nodes.
- Data ingestion and ranking flow for daily usage.
- Prometheus/Grafana observability baseline for hosts and services.
Live Access
- Live: securitypulse.online
Current Status and Next Expansion
The project is operational and presentation-ready, with real workflow value for daily triage.
Planned next step:
- improve platform functionality, streamline analyst workflows, and address UI/logic bugs identified during daily use.
Outcome
CyberOps Portal demonstrates not only tool usage, but full-stack DevOps + Security thinking: architecture, reliability, exposure model, data flow, and actionable operations in one coherent system.