Repository
Problem
Monitoring was fragmented across tools and teams, creating alert noise, poor visibility, and slow incident response.
- Fragmented monitoring made it hard to correlate signals across systems.
- Alert noise overwhelmed on-call engineers and hid real incidents.
- Lack of visibility into service health delayed root-cause analysis.
- Slow incident response increased downtime and escalations.
Architecture Diagram
This platform centers on a Zabbix server that collects metrics from lightweight agents, feeds Grafana dashboards, and drives a clear alert flow to the on-call team.
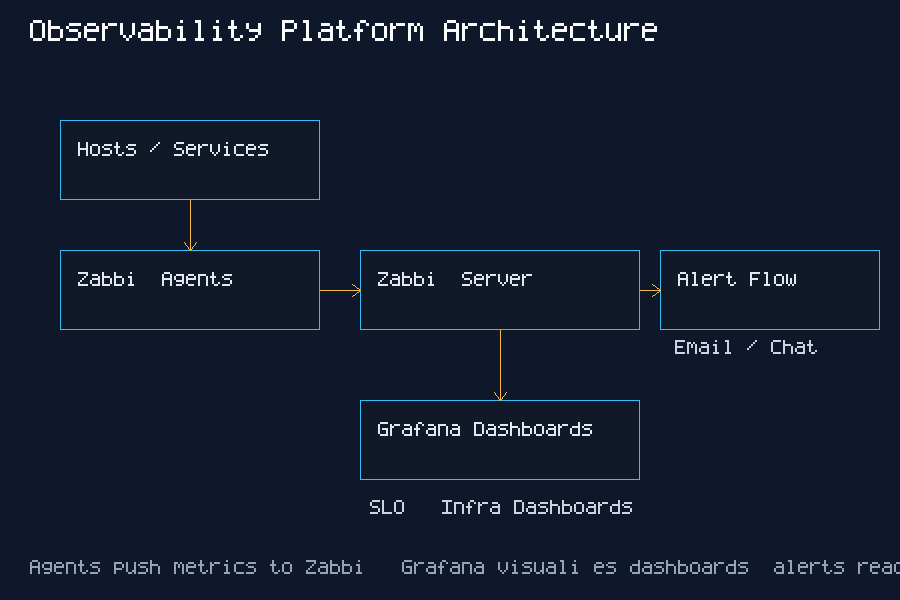
Hosts / Services
      |
  Zabbix Agents
      |
 Zabbix Server
      | \
      |  -> Alerting (Email / Chat / On-call)
      |
Grafana (Zabbix Datasource)
      |
Dashboards + SLA Reports
Setup Steps
- Deploy Zabbix server and agents with standardized templates.
- Connect Grafana to Zabbix datasource and validate metrics.
- Create dashboards for infra health, services, and SLA reporting.
- Configure alert rules, routing, and maintenance windows.
Dashboard Walkthrough
- Overview: Top-level SLO health, active alerts, and current incident count.
- Latency: P50/P95 response times to identify user impact and spikes.
- Error Rate: 4xx/5xx trends for regression detection after deploys.
- Host Health: CPU, memory, disk pressure, and network saturation per host group.
- Database: query latency, connection count, and replication lag.
- Queues: backlog depth and processing rate to spot stuck workers.
Alert Example
- Threshold: API error rate > 2% for 5 minutes.
- Trigger: Zabbix fires a critical alert when the rolling error rate breaches threshold.
- Response: On-call checks Grafana error panel, rolls back the last deploy, and validates recovery.
Incident Response Runbook (Example)
- Alert received: Critical trigger fires (CPU saturation or service down).
- Triage: Check Grafana dashboard, confirm host status, inspect recent changes.
- Escalation: Page service owner if SLA is at risk or incident persists >15 minutes.
- Resolution: Apply mitigation, validate recovery, close alert with notes.
Incident Story
Zabbix triggered a critical alert for elevated latency on the checkout service during peak traffic. Grafana dashboards showed CPU saturation and a sharp rise in database wait time. The on-call engineer scaled the database read replicas and restarted a stuck worker queue, restoring normal latency within 20 minutes. A follow-up action adjusted alert thresholds and added a dashboard panel to track queue depth.
Screenshots
Metrics
- Hosts monitored: 58 Linux/VM nodes across prod and staging.
- Services monitored: 12 critical services (API, DB, queues, edge).
- Alert categories: availability, latency, capacity, error rate, and backup health.
- Typical incidents: disk saturation, noisy neighbors, slow DB queries, and queue backlogs.
Suggested validation sources: Zabbix alert history, Grafana dashboards, incident reports.
Before vs After
Monitoring Setup
Before: Multiple tools with isolated views and no shared dashboards.
After: Unified Zabbix + Grafana stack with standardized dashboards.
Alert Volume
Before: ~120 alerts/day with frequent duplicates.
After: ~75 alerts/day with tuned thresholds and routing.
Response Time
Before: MTTR ~45 minutes.
After: MTTR ~25 minutes.
Lessons Learned
- Alert fatigue tuning requires ruthless pruning and ownership-based routing.
- Dashboard design improves adoption when centered on service outcomes.
- Agent scaling works best with automation and standardized templates.
- Incident workflow clarity reduces triage time and escalations.